Excel Spreadsheet to Flowchart turns data sheets into clear diagrams. It helps you see steps and organize ideas in a simple, visual way.
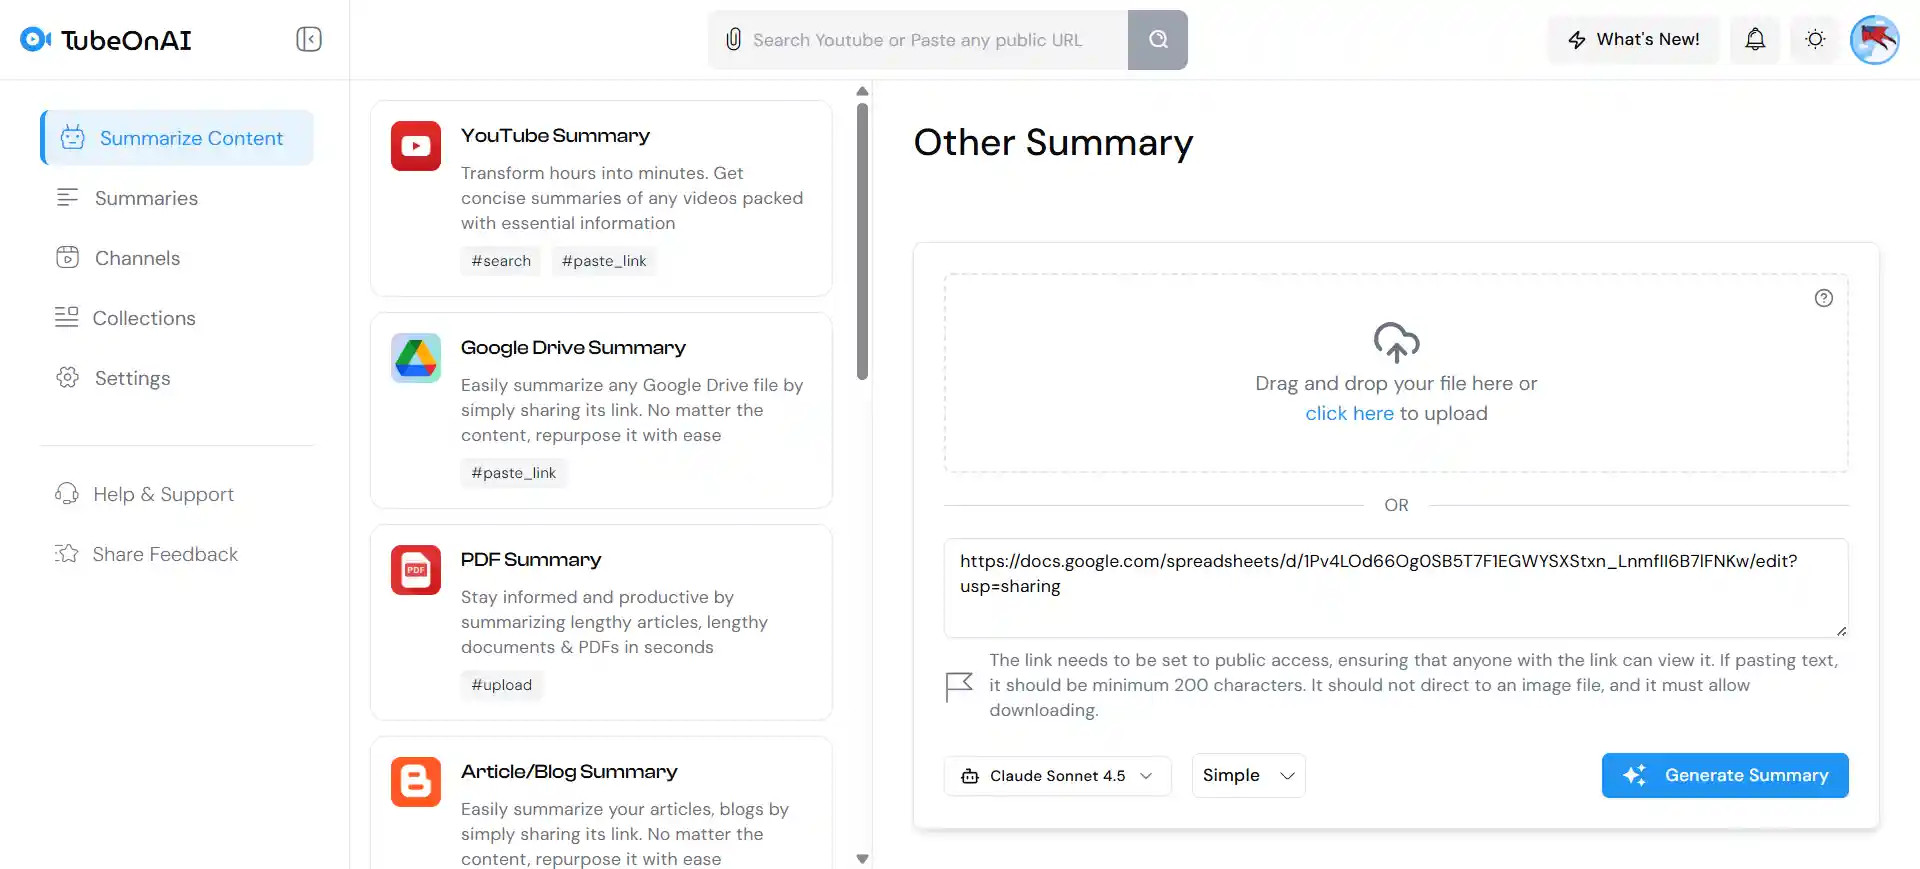
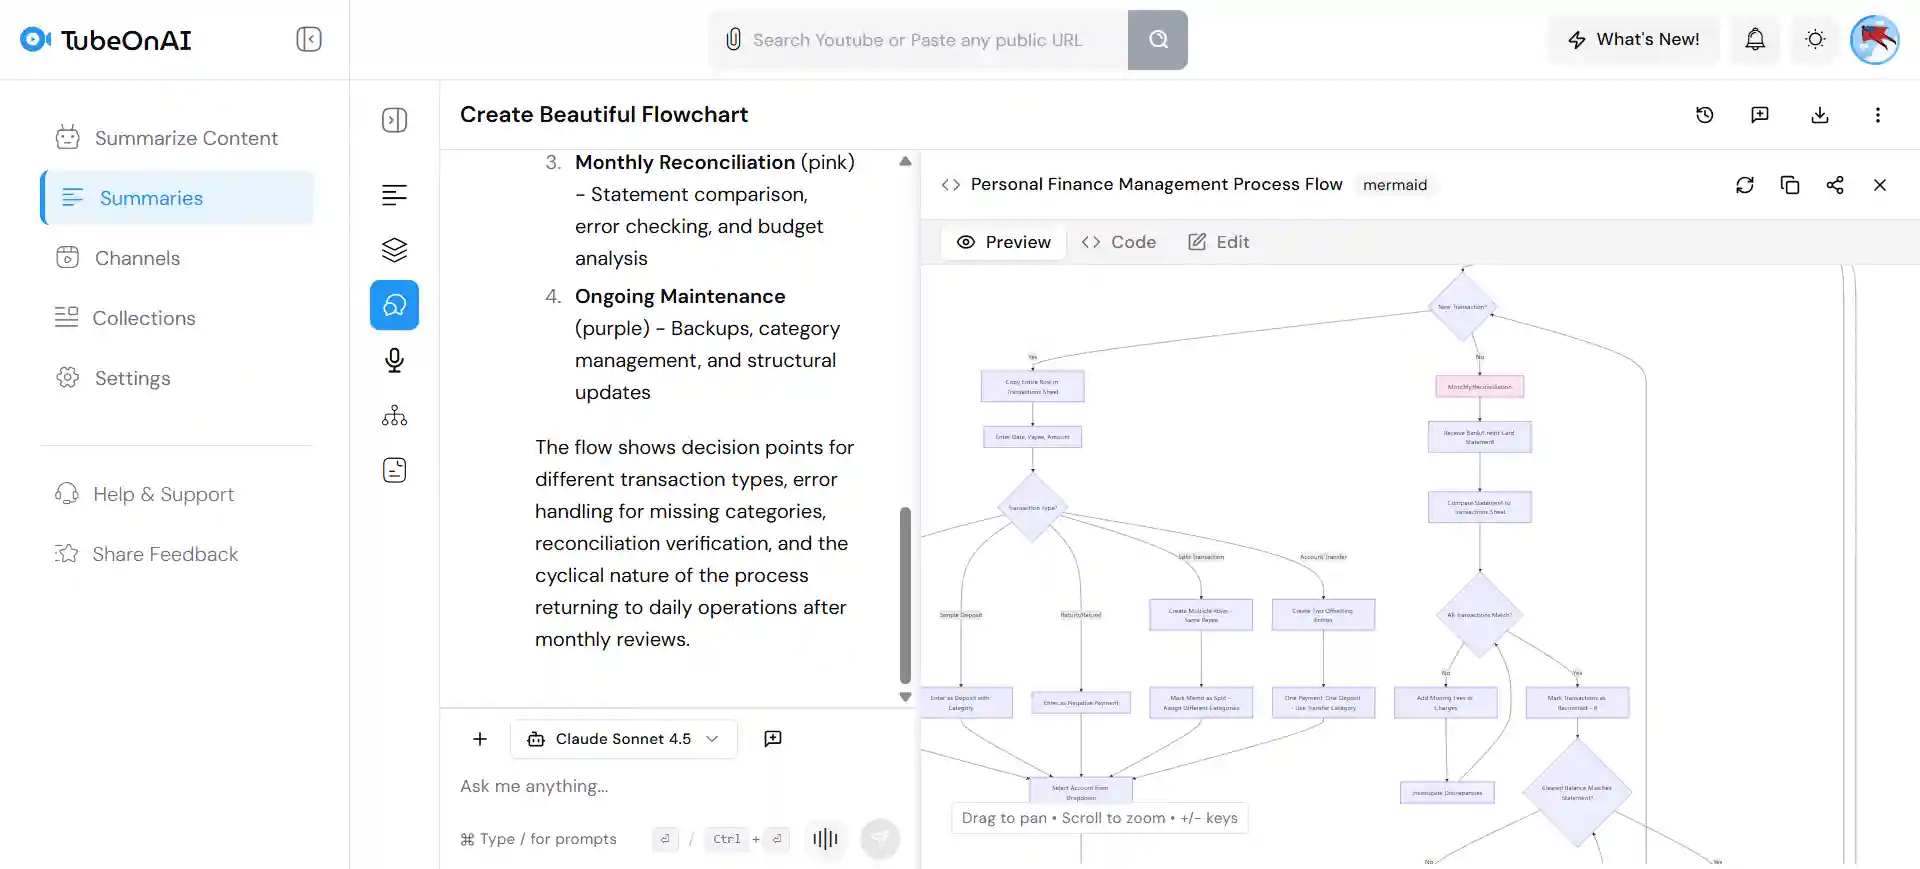
Excel to Flowchart converter extracts data from the file, breaks it into logical steps, and analyzes the sequence. Then it converts or arranges those rows into connected visual shapes. Finally, it outputs a structured diagram optimized for process tracking or presentation.
Paste the public URL or Upload the Excel file directly in TubeOnAI.
TubeOnAI summarizes your Excel sheet and explains each parts beautifully.
Use our Ask Follow up feature create your Flowchart.
Easily translate text inside your flowcharts into over 40 languages. Perfect for global teams, international business, or sharing processes in different languages.
Transform your diagrams into blog posts, emails, or training manuals instantly. The AI explains the logic in text, helping you share processes easily on any platform.
The AI automatically scans your data to spot logic errors, missing steps, or common bottlenecks. It helps you improve your workflow and increase efficiency.
Turn any Excel Sheet into clean, structured Flowchart in seconds – summarize, view, and download instantly. Try it free today.
Takes hours to draw boxes and connect lines manually.
Quality varies based on your patience and design skills.
Hard to keep spacing consistent across large charts.
Easy to miss steps or make mistakes in the process logic.
Requires redrawing the whole chart if data changes.
Converts data rows into diagrams in seconds accurately.
Finds logical connections that are hard to see manually.
Offers automatic styling for professional results instantly.
Perfect for quick reports, analysis, and presentations.
Delivers clear, organized charts with zero fatigue.
The tool changes data tables into flowcharts, making complex logic easier to learn and study.
Turn complex spreadsheets into clear diagrams for better team communication and workflow tracking.
Create lesson materials faster by turning data rows into clear visual steps for your students.
TubeOnAI uses smart technology to read your rows and columns. It looks for connections between steps to figure out the correct order. Then, it automatically places decision shapes (diamonds) and process boxes (rectangles) where they belong.
Drawing in Excel requires you to drag and drop every single shape manually. TubeOnAI does the hard work for you. It turns your data list into a finished diagram instantly, saving you hours of frustration.
TubeOnAI supports all languages. Since the tool focuses on the connections between rows, it will perfectly organize your text into a flowchart, regardless of the language you use.
Yes. If your Excel data includes different outcomes (like “If Yes, go to Step B”), TubeOnAI recognizes this structure. It will split the path in the flowchart to show the different directions clearly.
Absolutely. TubeOnAI is designed to work on mobile devices. You can upload a spreadsheet from your phone, and our tool will generate the flowchart for you to view or share on the go.