Investment research has never moved this fast.
In 2026, you can pull apart a company’s fundamentals in a few clicks. Picture yourself at your desk — markets are moving, and you need clarity now. Instead of spending hours digging through earnings calls, filings, charts, and news, you have AI tools beside you that can summarize, compare, and surface the signals that matter in minutes.
That sounds like a shortcut. In some ways, it is. But these tools do not replace your judgment. They remove friction. You get to the right information faster, with fewer dead ends. You can organize your watchlist, extract insights from reports, track catalysts, and catch patterns you might overlook when fatigue sets in.
In this blog, you will see the 10 most useful AI tools for investment research — and how to apply them in a real workflow. Whether you are a beginner building conviction on your first few picks, a long-term investor tracking quarterly trends, or an active trader scanning for setups, these tools can sharpen your process and reduce the noise.
Here is what is worth your attention.
Best Tools for Idea Discovery and Deep Research
AlphaSense — AI-Powered Market Intelligence for Deep Company Research
AlphaSense is a research platform that lets you search SEC filings, earnings transcripts, broker research, expert call transcripts, and news — all from a single search bar.
One of the most draining parts of investment research is wading through lengthy documents just to find one key detail, a single management comment or a buried revenue figure. AlphaSense cuts through that with semantic search and AI-generated summaries, so you can pull the exact quote or metric in seconds instead of scrolling for twenty minutes.
The platform also includes sentiment analysis, real-time alerts, and collaborative tools for team-based research. As of 2026, AlphaSense is trusted by over 6,000 enterprise customers, including a majority of the S&P 500 and many of the top hedge funds.
I would rate AlphaSense an 8/10 for serious research depth, but it leans heavily toward institutional users. The interface has a learning curve, and beginners may find the sheer volume of data sources overwhelming at first.
Pricing is enterprise-focused and quote-based. AlphaSense does not publish a standard self-serve monthly price — you need to contact their sales team for a custom annual subscription.
Best AI Tools for Market Scanning and Technical Signals
TrendSpider — Automated Technical Analysis
TrendSpider is a charting and scanning platform that helps you spot trends, patterns, and setups with far less manual effort than traditional charting tools.
A persistent challenge for investment researchers is missing key technical signals because reviewing charts across dozens of tickers every day takes too long. TrendSpider automates trendline detection, pattern recognition, and multi-timeframe analysis, so you can scan more tickers in less time and focus on the setups worth acting on.
The platform also offers backtesting without needing to write code, dynamic price alerts, and AI-powered trading bots (called Sidekick) for strategy automation.
I would rate TrendSpider a 9/10 — it saves meaningful time, the interface is well-designed, and it eliminates a significant amount of repetitive chart work. The main drawback is that it can feel complex for complete beginners.
Pricing is paid with no free tier (though a 14-day paid trial is available). Plans start at approximately $82 per month for the Standard tier when billed monthly. The Premium and Enhanced tiers run higher, up to roughly $155 per month. Annual billing brings those numbers down noticeably.
Trade Ideas (Holly AI) — Real-Time AI Stock Scanner
Trade Ideas is built for active traders who need real-time scans, alerts, and AI-generated trade signals throughout the trading session.
A common frustration for active researchers is the nonstop flow of market data. Price moves, volume spikes, news releases — it all comes at once, and it is hard to separate what deserves attention from what is noise. Trade Ideas filters this with over 40 pre-built scans and Holly AI, an algorithm that runs millions of backtests daily across 8,000+ US stocks and surfaces 5 to 25 trade ideas each session.
Holly AI generates entry prices, stops, and targets for each signal. The platform also includes a paper trading simulator, community tournaments, and broker integration through Interactive Brokers and E*TRADE.
I would rate it an 8/10 — fast and powerful for day traders, but it can feel intense and cluttered if you prefer slower, long-term research. There is a real learning curve to configuring it well.
Pricing has changed: Trade Ideas now offers a free basic (Par) plan, a Birdie Bundle at approximately $118 per month, and the Eagle Elite plan (which includes Holly AI) at about $228 per month. Annual billing provides meaningful savings.
Tickeron — AI Pattern Recognition with Automated Trading Bots
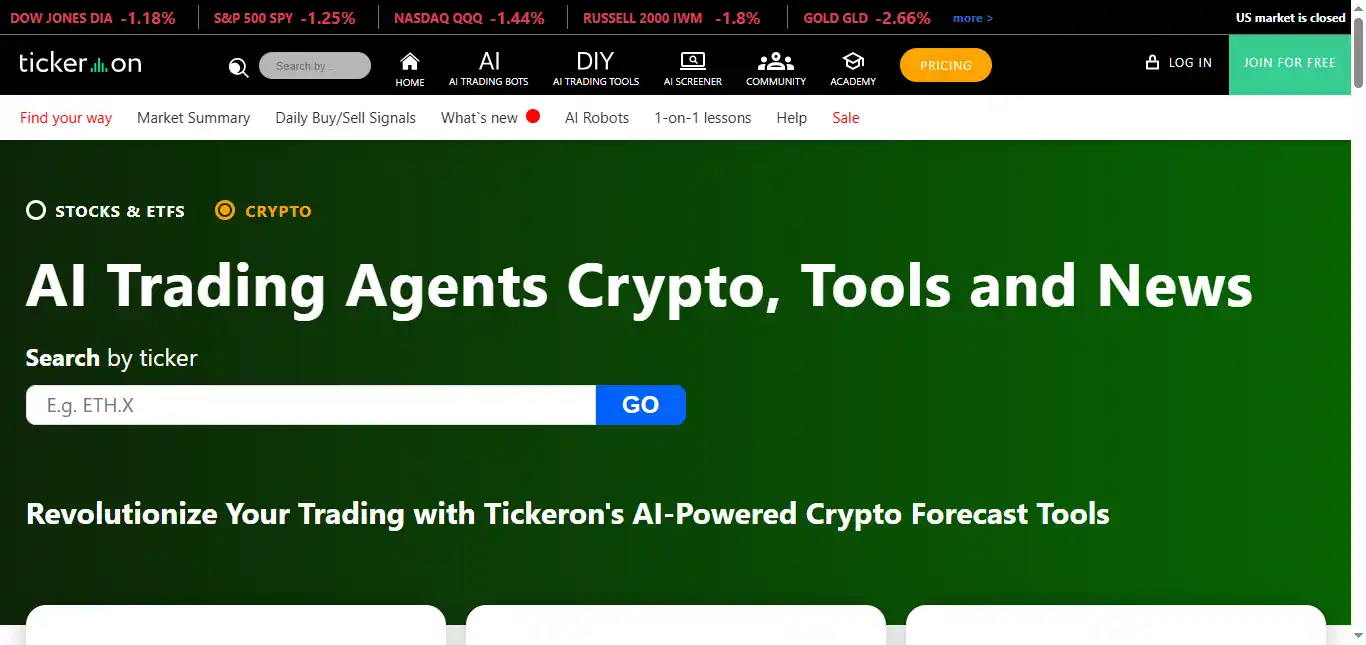
Tickeron is an AI-driven platform that delivers forecasts, pattern detection, and trading signals across stocks, ETFs, forex, and crypto.
A real challenge for investment researchers is converting raw chart data and indicators into clear, actionable signals with enough confidence to pull the trigger. Tickeron addresses this by scanning markets with proprietary algorithms, recognizing up to 40 chart patterns, and assigning AI confidence scores and success probabilities to each trade idea.
The platform also offers AI-managed portfolios, community-driven voting on stock direction, and a backtesting tool (Time Machine) that lets you validate strategies against historical data.
I would rate it a 7/10 — it is strong for idea generation and quantitative pattern scanning, but you still need independent analysis before acting on any signal. The pricing structure is also unusually complex.
Tickeron has a free Beginner plan for basic access. Paid plans include Investor ($60/month), Swing Trader ($80/month), Day Trader ($90/month), and Expert ($250/month). Annual billing cuts costs by up to 50%.
Best Tools for Research Capture and Organization
Fireflies.ai — AI Meeting Transcription and Note-Taking
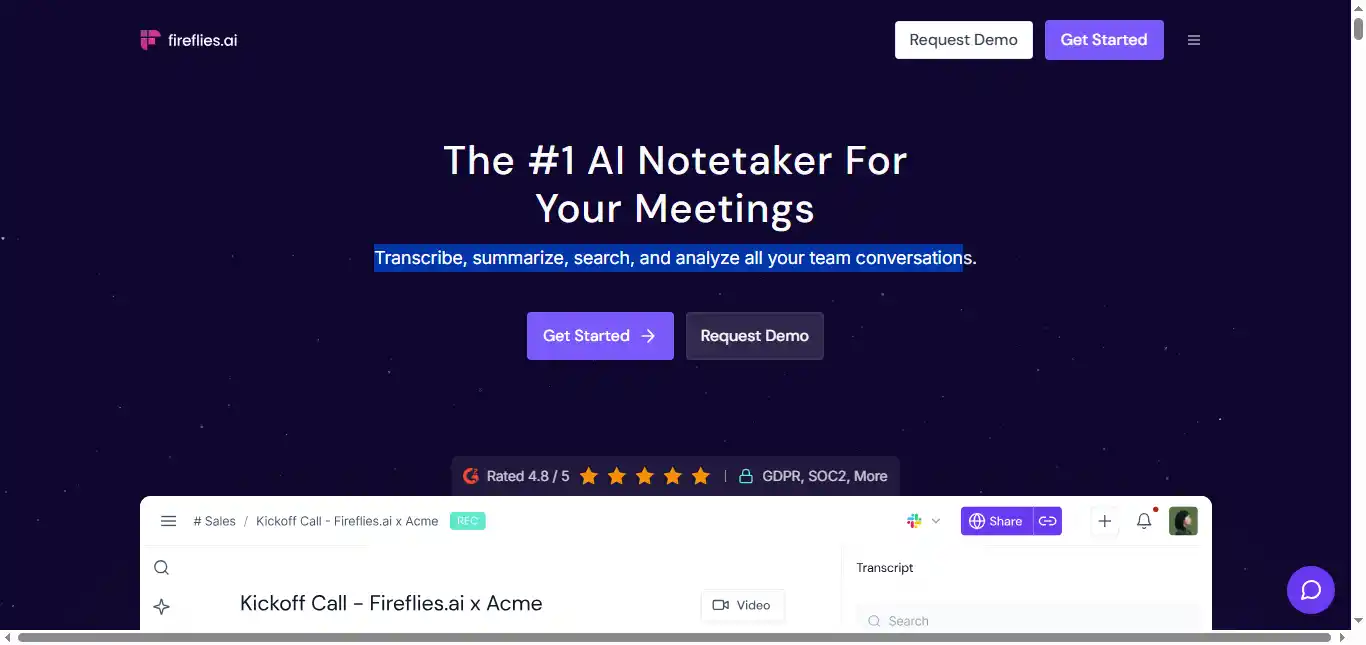
Fireflies.ai is a meeting assistant that records, transcribes, and summarizes calls automatically — so you do not lose important details from conversations that move fast.
A frequent pain point for investment researchers is losing track of what was said during expert calls, earnings discussions, or internal team debates. Key quotes, numbers, and decisions fade from memory quickly. Fireflies turns conversations into searchable, timestamped transcripts with AI summaries and action items, making it straightforward to pull specific details later.
The tool integrates with Zoom, Google Meet, Microsoft Teams, and most major video conferencing platforms. It also connects to CRMs and project management tools on higher-tier plans.
I would rate it a 9/10 — setup is simple, reliability is solid, and it saves a meaningful amount of post-call work.
It is freemium. The Pro tier is $18 per user per month when billed monthly, or about $10 per user per month on annual billing. Note that AI credit limits apply even on paid plans — heavy users of the AI assistant (AskFred) may hit caps and need add-on credits.
Otter.ai — Real-Time Meeting Transcription with Searchable Archives
Otter.ai is a transcription and note-taking tool that helps you capture interviews, calls, and research conversations in clean, readable text — with real-time captions as the meeting happens.
A recurring problem for investment researchers is losing track of what was said in interviews, especially when exact wording matters for building a thesis or sharing with a team. Otter creates searchable transcripts with speaker identification and AI-generated summaries, so you can find names, numbers, and key decisions without replaying audio.
Otter also offers custom vocabulary (useful for industry jargon), filler word removal, and slide capture during virtual meetings.
I would rate it an 8/10 — very accessible for daily use, with strong search and sharing features for small research teams. The main limitation is that transcription minutes are capped on every plan, which can be restrictive for high-volume users.
It is freemium. The Pro tier costs $16.99 per user per month when billed monthly, or $8.33 per user per month on annual billing. The Business tier runs $30 per month (monthly) or $20 per month (annual) and includes 6,000 transcription minutes.
Best Tools for Writing and Analysis Support
Grammarly — AI Writing Assistant for Grammar, Clarity, and Tone
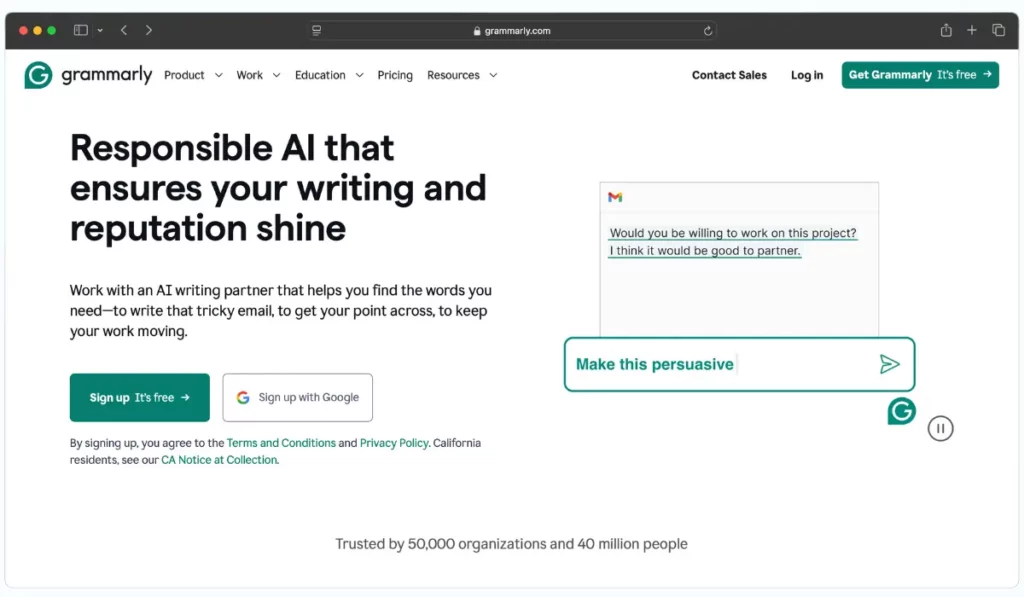
Grammarly is a writing tool that catches grammar mistakes, sharpens tone, and improves clarity — so your research notes and client-facing reports read cleanly under pressure.
A common issue for investment researchers is writing quickly during volatile markets or after long research sessions, resulting in messy notes, unclear summaries, or sloppy client updates. Grammarly flags those issues in real time and suggests fixes, so your thesis reads clearly the first time around.
Beyond grammar, Grammarly Pro now includes full-sentence rewrites, tone adjustments, a plagiarism checker, and 2,000 monthly AI writing prompts.
I would rate it a 9/10 — it is fast, frictionless, and genuinely improves almost any piece of writing with minimal effort.
Pricing has changed: Grammarly renamed its Premium plan to “Pro.” The Pro plan costs $30 per member per month on monthly billing, or $12 per member per month on annual billing. There is no separate Business plan anymore — larger teams use Grammarly Enterprise (custom pricing).
Jasper — AI Content Platform for Marketing and Research
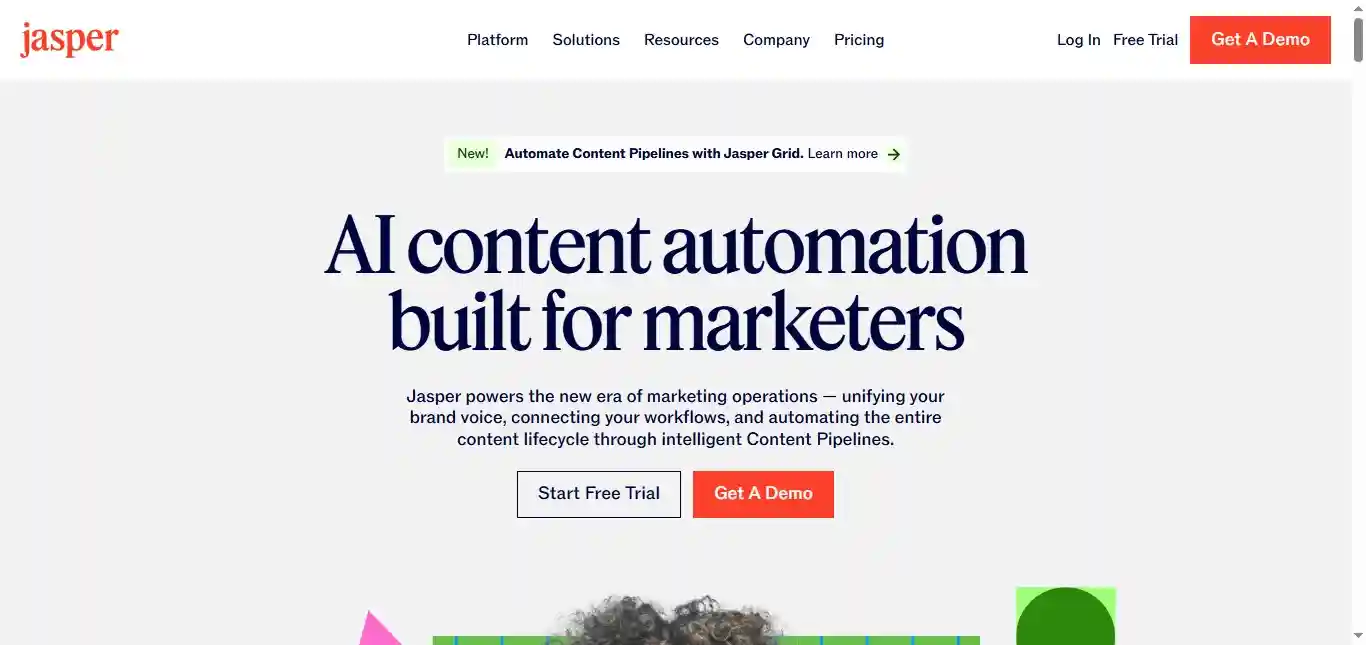
Jasper is an AI writing and content platform built primarily for marketing teams, but useful for anyone who needs to turn rough notes into polished, structured output quickly.
A recurring challenge for investment researchers is converting messy research notes into clean updates that clients, portfolio managers, or teammates can act on immediately. Jasper accelerates this by generating first drafts, restructuring content, and maintaining a consistent brand voice across memos, briefs, and market recaps.
The platform includes over 50 content templates, SEO tools, a browser extension, and a no-code AI app builder on higher tiers. It supports over 30 languages and offers brand voice customization.
I would rate it a 7/10 — Jasper is strong for speed and structure, but the output needs careful fact-checking. It is also built more for marketing use cases, so it may feel slightly off for pure investment writing. Keep your own analytical voice in final drafts.
It is paid with a 7-day free trial. The Pro plan costs $69 per month billed monthly, or $59 per month on annual billing. A Creator plan at $49 per month (or $39 annually) covers solo users with lighter needs. Business pricing is custom.
Best Tools for Visuals and Presentation of Research Outputs
Gamma — AI-Powered Presentation Creation
Gamma is a fast way to turn your ideas into clean presentations and shareable pages without spending hours wrestling with slide design.
A persistent pain point for investment researchers is building clear, client-ready decks from dense research when time is tight and the data is complex. Gamma addresses this by generating a strong slide structure and visual layout from your notes or bullet points, so you can focus on the narrative and key data points instead of alignment and formatting.
The platform also supports embedded charts, web content, and collaborative editing — making it practical for team-driven research presentations.
I would rate it an 8/10 — it is quick, the output looks modern, and it dramatically reduces the usual friction of slide creation.
It is freemium, and the Pro tier is commonly listed at $20 per month (with lower pricing on annual billing).
Canva — AI-Assisted Design for Charts, Visuals, and Presentations
Canva with Magic Design helps you create charts, data visuals, and clean layouts fast — even if you have zero design background.
A real problem for investment researchers is producing visuals that look credible and professional rather than rushed, especially when presenting data to clients or senior stakeholders. Canva solves this with thousands of ready templates, drag-and-drop editing, and AI-assisted design suggestions that produce polished results in minutes.
Canva also handles infographics, social media graphics, and branded templates — making it useful well beyond just slide decks.
I would rate it a 9/10 — it is easy to learn, deeply flexible, and consistently makes research outputs look more professional.
It is freemium, and Canva Pro is commonly listed at $12.99 per month for individuals.
What About Dedicated Portfolio Trackers and Sentiment Tools?
One gap in the list above is that none of these tools focus specifically on portfolio tracking or market sentiment analysis — two areas where AI has made real progress.
For portfolio tracking and fundamental screening, tools like Koyfin and Simply Wall St use AI to visualize financial data, compare valuations, and monitor portfolio performance across multiple holdings. If your research bottleneck is not reading documents but rather organizing and comparing the companies you already follow, a dedicated tracker can fill that gap.
For sentiment analysis, platforms like Sentifi and StockGeist aggregate social media, news, and forum discussions to gauge crowd sentiment around specific tickers. This can serve as an additional signal layer — not a primary research input, but a useful cross-reference when you want to understand how the broader market perceives a stock before you commit.
If you find yourself spending too much time manually tracking positions or wondering what the crowd thinks about a name you are researching, these categories are worth exploring alongside the tools above.
How to Choose the Right AI Tools for Your Investment Research Workflow
If you are considering which AI tools to add to your research process, here is how to think about it without overcomplicating the decision.
Start with your biggest friction point. What part of research drains you the most? Is it reading long earnings calls? Digging through filings? Staring at charts for setups? Keeping notes organized after calls? Pick a tool that directly addresses that one pain — that is where you will notice the biggest difference first.
Prioritize tools that show their sources. A tool is only useful if you can verify what it tells you. Choose tools that surface exact quotes, link to original filings, or let you search inside the source documents. If a tool gives you answers but hides where they came from, it is risky to trust for real money decisions.
Match the tool to your research style. If you are a long-term investor, you will get the most value from tools that summarize reports, compare companies across quarters, and keep your research organized over time. If you trade actively, you want scanners, real-time alerts, and technical signals. Same goal — finding edge — but different workflows.
Keep the stack small. You do not need ten tools. A practical setup is four: one for deep research, one for scanning or screening, one for capturing notes and calls, and one for writing or presentations if you share your work. Then test each tool with one stock you already know well. If the tool makes you faster and more confident, keep it. If it feels like extra overhead, cut it.
Should You Use an LLM Like ChatGPT or a Dedicated App?
This is not an either-or question. Each type of tool has a distinct strength, and the best research workflows combine both.
Use an LLM when you need reasoning, synthesis, or writing. LLMs are strong when you want to turn messy notes into a clear thesis, summarize text you paste in (earnings call excerpts, PDF highlights, your own bullet points), compare two companies based on your own analysis, draft a watchlist plan or investment checklist, stress-test your idea by asking what could go wrong, or quickly reframe your analysis for a different audience (client memo versus internal notes).
Use a dedicated app when you need verified data and structured workflows. Specialized research tools outperform LLMs when you need real filings, transcripts, and news sourced directly inside the tool with citations; document search that returns exact quotes with page-level references; scanners, alerts, watchlists, and catalyst trackers; or charting, backtesting, and technical signal generation.
An LLM is strongest for reasoning, synthesis, and writing. A dedicated research app is strongest for sourced data, structured analysis, and workflow automation. For serious investment research, you will likely need both working together.
One important caution: LLMs can produce hallucinations — statements that read convincingly but are factually wrong. This matters more in investment research than in most other use cases, because a fabricated number or a misattributed quote can directly cost you money. Always verify any LLM-generated claim against a primary source before acting on it.
